data tells the story as the d&i dashboard demonstrates
Jasmin Danzeisen Senior Manager Culture & Change at PwC Switzerland
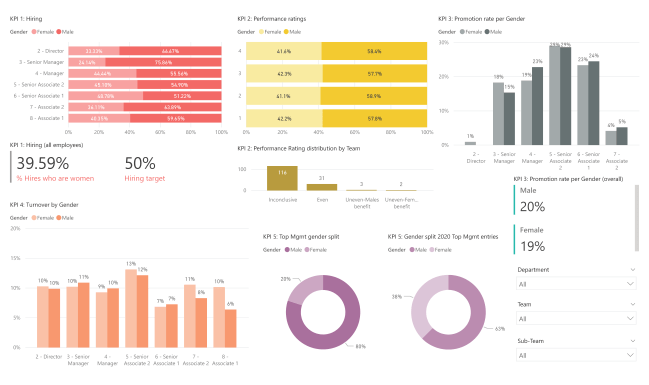
PwC Switzerland’s D&I dashboard is designed to support data driven decision-making from a D&I strategy perspective, at the level of HR and Top Management. The concept first came about as a tool for PwC Switzerland’s internal D&I planning and monitoring. It proved to be a highly effective means for securing Top Management engagement and ownership of PwC Switzerland’s D&I initiatives. As a result, PwC Switzerland made it available outside of the organization as well.
This best practice was first published in the Gender Intelligence Report 2020. read the report
The dashboard is offered in Microsoft Power BI software and is designed to be highly interactive. While the current visualizations have served us well, the D&I topic and the demands from Top Management are evolving fast. For this reason, we have applied a design thinking approach to prototyping and testing the dashboard to allow us to build in new visuals, alternative metrics or additional aspects of diversity as our needs evolve.
REAL-TIME D&I ANALYTICS HELP US TO ACT MORE EFFECTIVELY
The introduction of a new HR system provided us with a window of opportunity to make the case for a new D&I dashboard. We wanted to ensure access to real-time D&I analytics in order to inform, monitor and assess our D&I actions. These analytics are:
up to date and easily refreshed
easily accessible from our HR system
comprehensive: HR demographic data (age, gender, nationality), employee lifecycle (talent attraction, talent management information), complemented with well-being information, employee satisfaction
comprehensible for all stakeholders (HR but also non-HR): easily understood by a wide audience, notably including senior leadership, without much explanation
FROM CONCEPT TO DELIVERY IN JUST A FEW MONTHS FOR THE D&I DASHBOARD
The lockdown served us as we could use it to take time for thinking, building and testing. We made use of our own D&I and data analytics capabilities to build a D&I dashboard exactly suited to our needs while incorporating best practices learnt from exchanging with other organizations.
It is built on known metrics used within the firm. These include KPIs tracked globally and at European level by our network of firms, as well as KPIs we monitored in the context of our regular management reviews; this notably included KPIs recommended as part of the EQUAL-SALARY Certification process. It posed an interesting challenge to find a way to make the dashboard both comprehensive in its content and intuitive to use. To find the right balance, we used an agile approach where we did not spend time in lengthy meetings to conceptualize the dashboard. Instead, we started building it based on a short brainstorming session, democratized a beta version, and continuously improved subsequent versions of the dashboard using design thinking and based on iterative feedback from user-stakeholders.
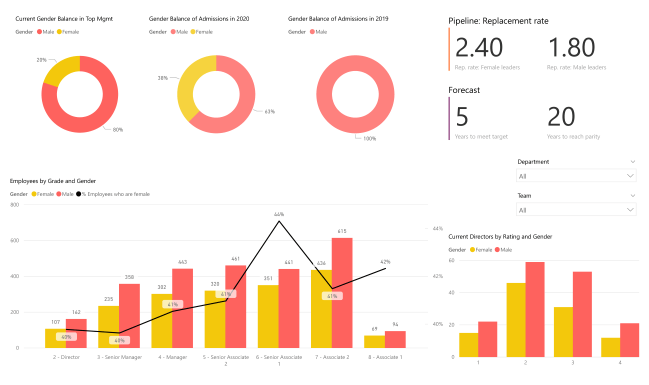
The D&I dashboard provides insights at firm level but also by department, unit and even team level. It allows for trend analysis thanks to access to historical data going back 3 to 5 years. This was a challenge we had to overcome as the new HR system meant that historical data was not readily available, so we had to access it via two different systems. It was worth it – having historical data is the only way to track real progress against D&I KPIs. And we went a step further. We incorporated a predictive functionality, which allows us to understand the future impact of our past and current decisions and take preventive, preemptive and corrective actions where needed.
THE D&I DASHBOARD ENABLES A DATA-DRIVEN APPROACH WITH LEADERSHIP AND HR
The D&I dashboard is used to inform our regular D&I strategy update meeting with the senior leadership. Since we have been showing such comprehensive data the frequency of these meetings has increased from once a year to quarterly.
The dashboard provides insights into key HR processes, enabling a data-driven approach in deep-dive sessions with the different HR teams (e.g. recruitment, talent management). Departments and units are compared against each other in terms of D&I progress using input from the dashboard, which is increasing leaders’ felt personal accountability for D&I. It has helped us to prioritize areas for further improvement and has helped us to learn from those parts of the firm that are most advanced in creating sustainable diverse and inclusive teams.
Diversity by grade and gender, demo data PwC 2020
WHAT WE LEARNED ALONG THE WAY
We took an agile and design thinking approach: we did not lose momentum in a long design process but started working with the beta version and fine-tuned the tool on the go.
We built it with our own capabilities and on pre-existing metrics that are relevant in other contexts as well but went one step further with the predictive functionality.
We made it a flexible tool: it can be further evolved based on need. For example, we plan to include well-being data and employee satisfaction information from surveys.
Most importantly we got stakeholder engagement (HR and non-HR): especially senior leadership was involved early on in testing the tool, which helped gain buy-in as well as ownership of actions decided based on the insights we got from the dashboard. Together with the senior leadership we developed a ranking system which is helping us to engage the business in D&I even further.
More best practices in the key area 'Lead from the Top'
NEW! Why Sponsorship is Our Key for the Next Generation of Female Leaders
How can you push gender equality in the right direction at a faster pace? At Bain, a sponsorship program is key for ensuring the top management pipeline and retaining female leaders.
Business Growth Through Diversity
SIX launches SPI Gender Equality Index for Switzerland, aligning their core business activities with their D&I Strategy.
How to Smash Gender Diversity Targets
48% of all PM Switzerland’s management level employees were women in 2020, smashing the target of 40% by end 2022.
Female Sponsorship Program: Who Says Women Aren't Ambitious?
Dow's Sponsorship Program is de-biased by self-nomination and busts the myth that 'there are no eligible women'
Cookies are not just tasty, they are also important for us to deliver you the best possible user experience. Therefore, this website uses cookies. By clicking on Ok you accept our use of
cookies and data privacy policy.
We wish you a valuable experience on our website!